


Description
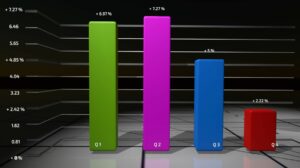
Bar Type Charts:
The bar type charts in Vset3D allow you to represent your data in a visually appealing horizontal or vertical bar format. With customizable options for colors, labels, and values, you can tailor the appearance of your chart to match your branding or desired aesthetic. Whether you’re showcasing sales figures, survey results, or any other data-driven information, the bar type charts offer a clear and concise representation.
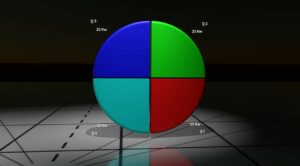
Pie Type Charts:
For a more comprehensive overview of data distribution, the pie type charts in Vset3D are the perfect choice. Create eye-catching pie charts that effectively communicate proportions and percentages. With intuitive settings to customize slices, labels, and colors, you can effortlessly highlight key insights and make your presentations or broadcasts visually impactful. Whether you’re illustrating market shares, demographic breakdowns, or project budgets, the pie type charts offer a compelling visualization.
Unlock the Potential of Data Visualization:
The new Chart Creation tool in Vset3D empowers you to transform raw data into visually stunning charts, adding depth and clarity to your virtual productions. Captivate your audience, convey information effectively, and elevate the overall visual experience with these dynamic and customizable charts.